
A crime statistics dashboard your department can run itself
A Power BI crime statistics dashboard for police departments, built from the RMS or CAD export you already produce. NIBRS counts by month, day and hour, a monthly board or council PDF that builds itself, and an analyst workbench for the questions that come in sideways. Built in about four to six weeks, and you own the file.
Below: a working demo on public Olathe Police Department records, a 60 second walkthrough, and how the work is priced.
The monthly report is due on the first. Again.
You are one person, or part of one. The monthly crime statistics report is due on the first, the chief wants it to look like last month's, and the council packet wants the same numbers in a different order. So the RMS export lands in Excel, the pivot tables get rebuilt, the NIBRS categories get recoded by hand because the export carries codes and the report wants names, and the "quick question" from a lieutenant about Friday nights in one beat takes an afternoon.
Then the numbers disagree. The dashboard says one thing, the state submission says another, last month's PDF says a third, and nobody can say which counting rule produced which figure.
A crime analysis dashboard for a small police department does not need to be a platform. It needs to answer the recurring questions from one definition of each number, refresh on a schedule, and leave you free for the analysis that is actually yours to do.
Three things, bought one at a time
A first project is usually one of these, sometimes two. Each is its own scope, its own quote and its own acceptance.
Crime statistics page
The page the demo below shows: pick a year, every figure updates. Totals and NIBRS classes against the prior year, monthly counts by class with last year drawn as a line, day of week by hour, the top offenses ranked on the NIBRS code already on the record, clearance where your export carries it. Built in Power BI, inside your own Microsoft tenant, refreshed from your export on a schedule.
Monthly board or council PDF
The recurring packet becomes a Power BI page laid out for print and exported on the first of the month, same layout, same definitions, no rebuilding. Your logo, your section order, your footnotes. If the board or council wants it emailed, it can be a subscription from the Power BI service with nobody clicking anything. Other recurring paperwork can be automated the same way: AI automation.
Analyst workbench
The page for the questions that come in sideways: any date range, any beat or district, any offense group, any hour band, with the record list underneath so an answer can be checked. Saved views for the questions that repeat. This is the one that gives an analyst the afternoon back.
Optional on any of the three: a public transparency view with no case detail, a map at a block-group or hexagon grain that cannot point at an address, and a NIBRS reconciliation page that shows where your local count and your state submission part ways.
Sixty seconds, on public police records
Every number below is computed from records the Olathe Police Department publishes on the City of Olathe Crime Map: 42,354 crimes and 20,857 traffic accidents from January 2021 to August 2026, and 79,285 calls for service over twelve months. Nothing is modelled or made up, and the page says so on its face. Olathe is a public data source for this demo, not a client.
Narrated walkthrough, 60 seconds, with captions. The demo is a web page so you can use it without a login; your dashboard is built in Power BI, which is why the next section is about your tenant and not ours.
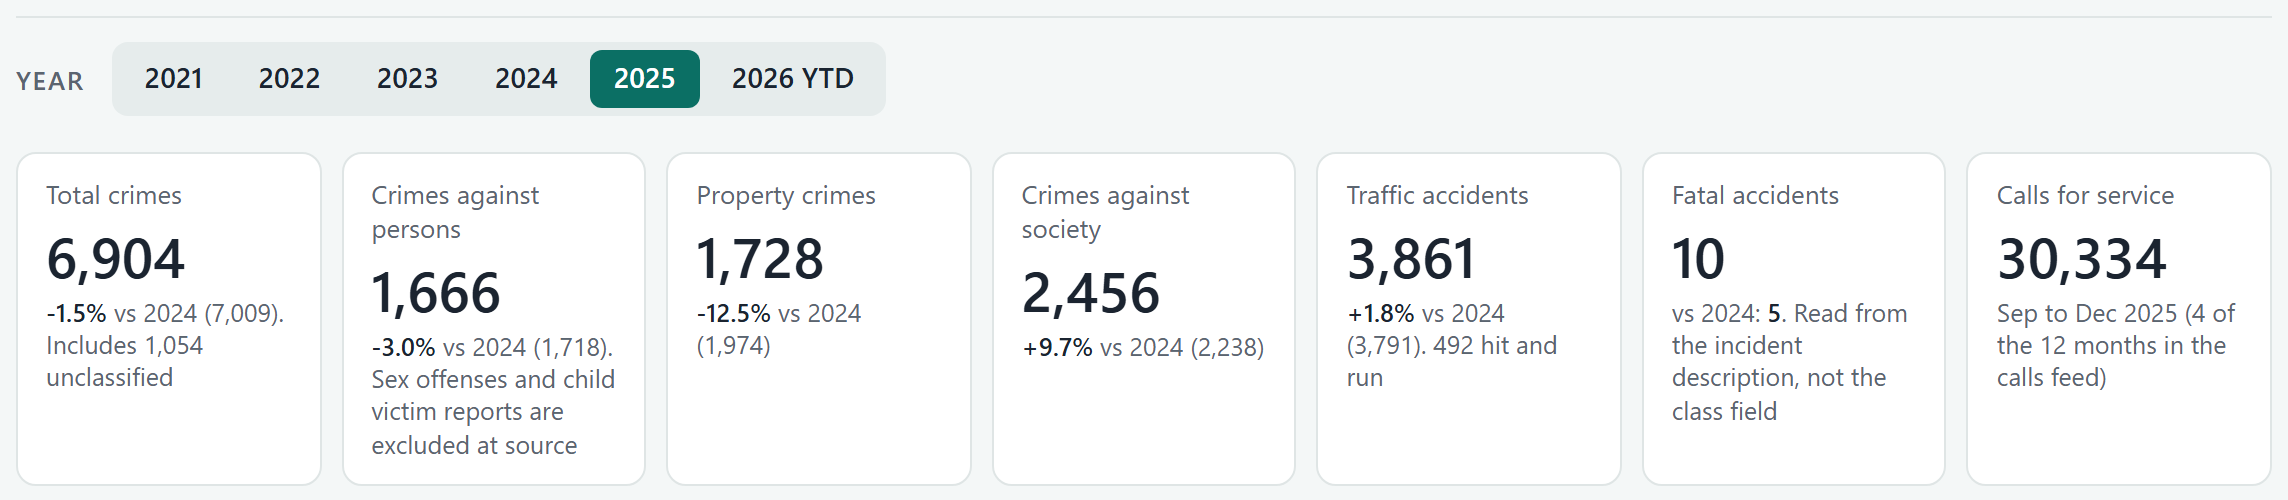
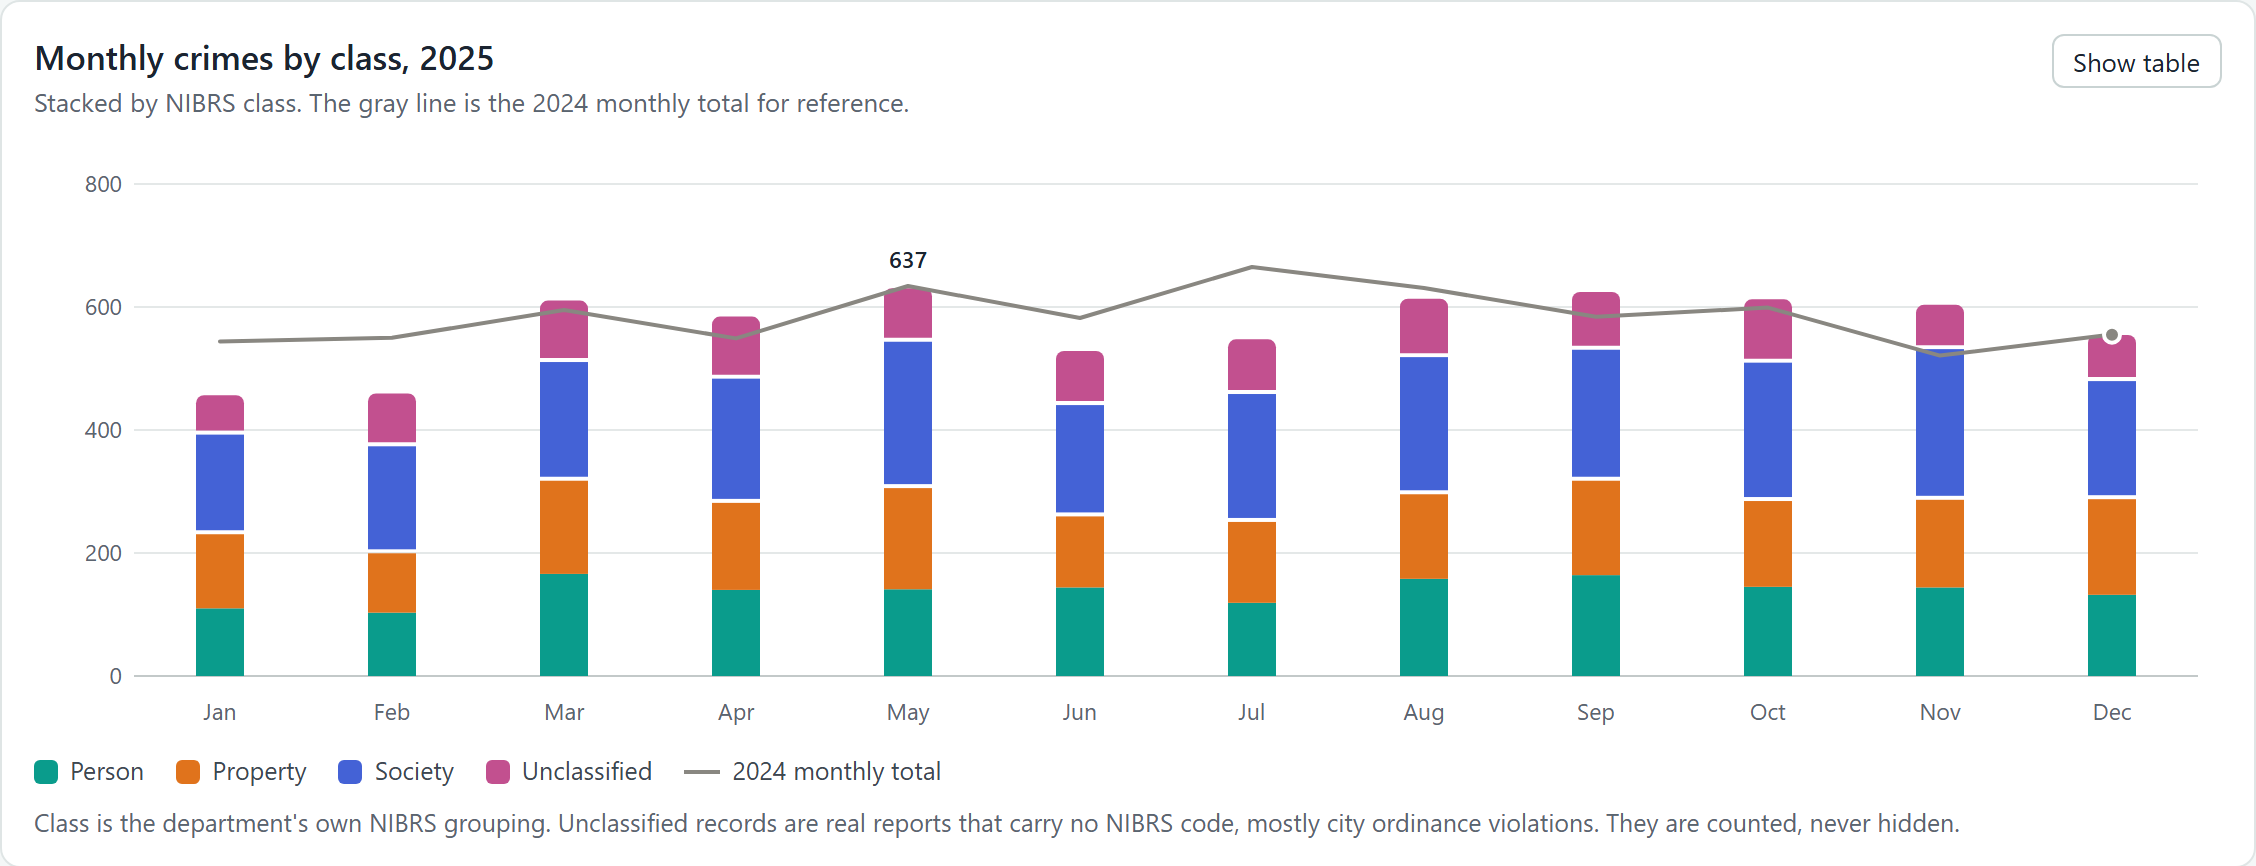
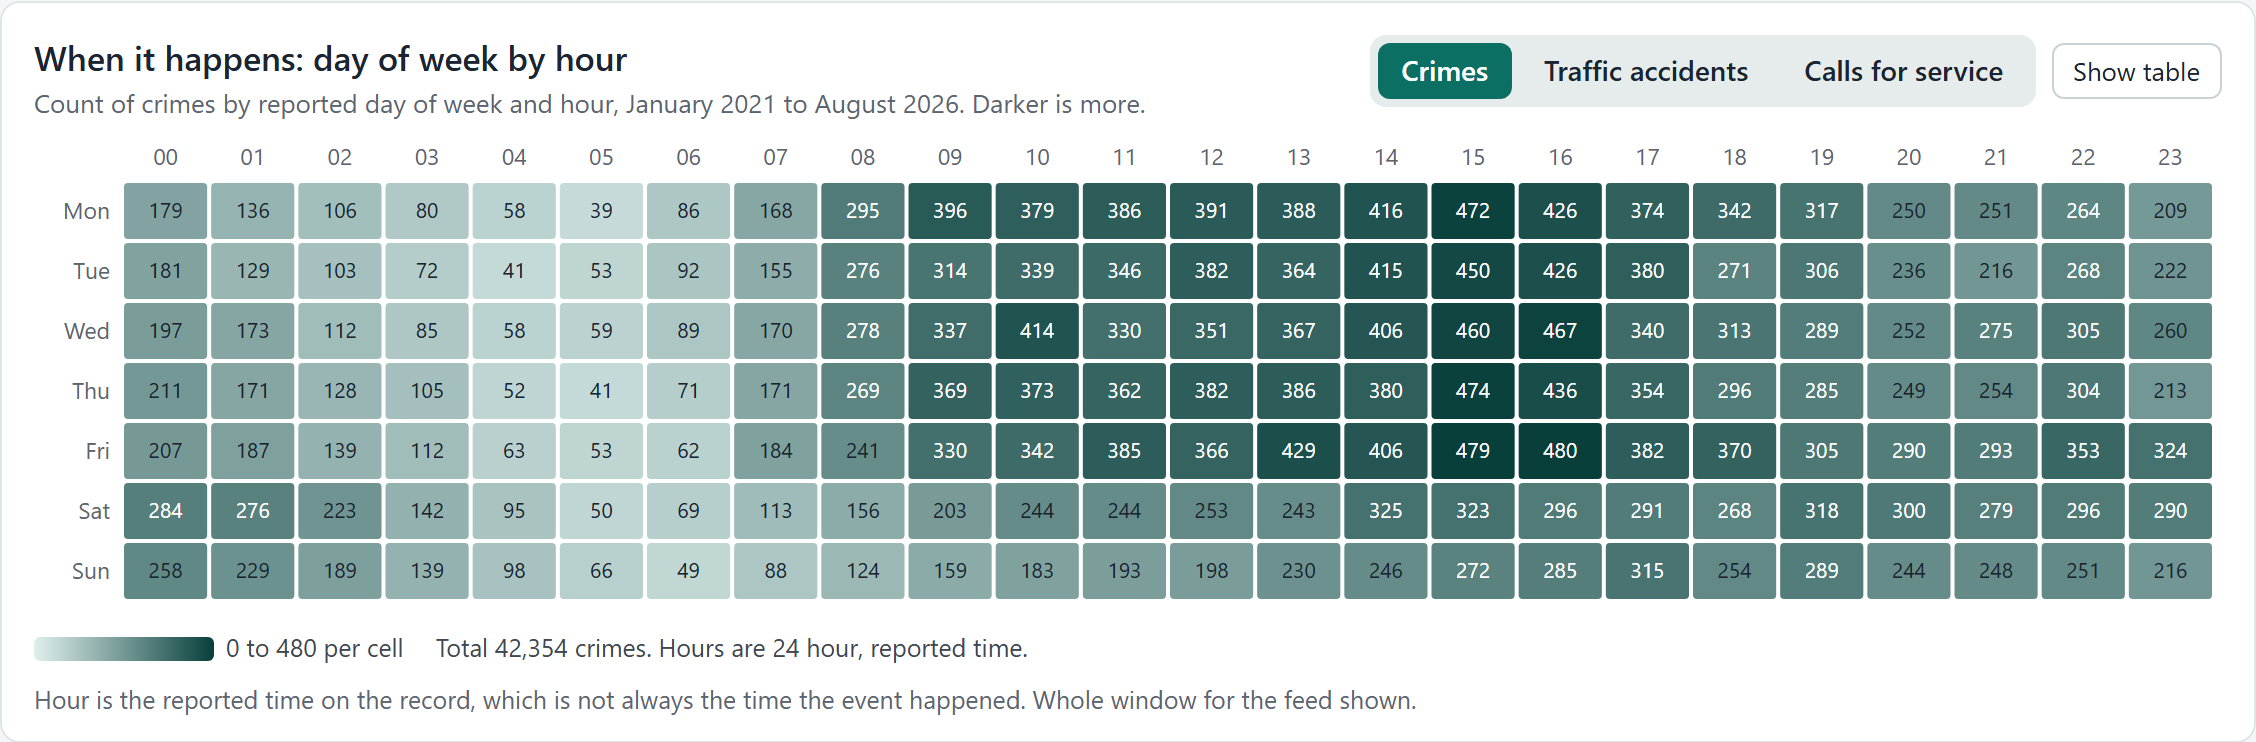
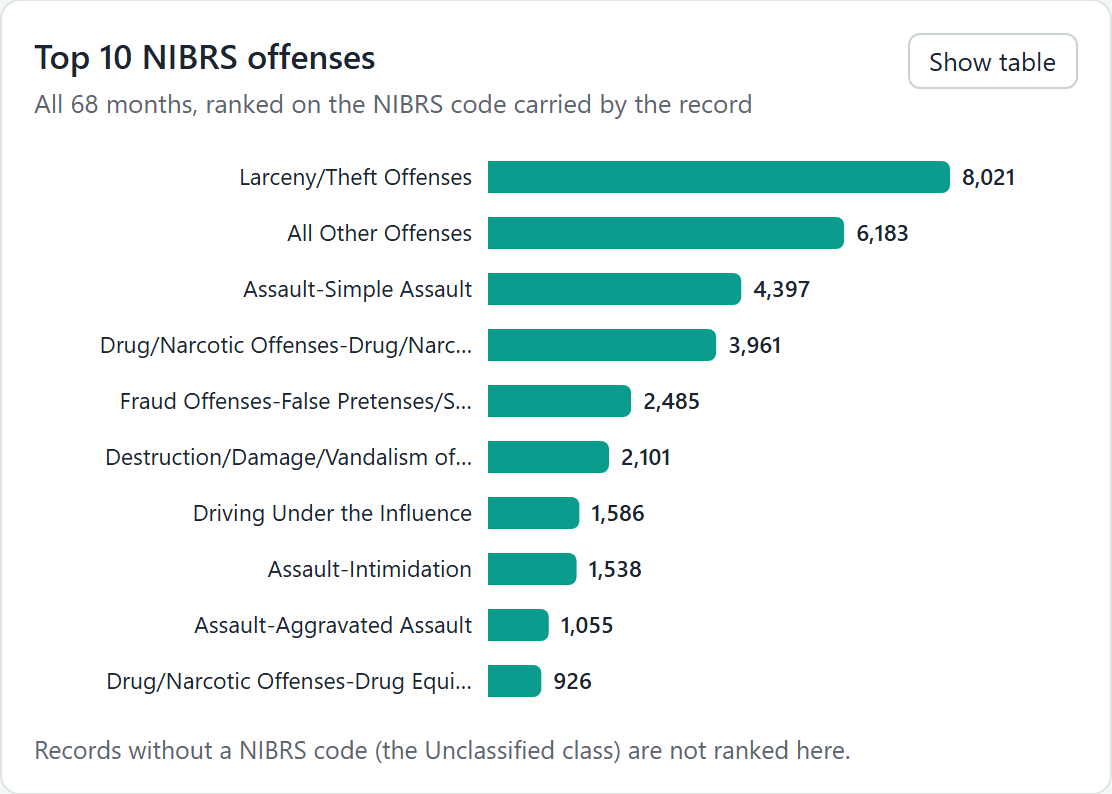
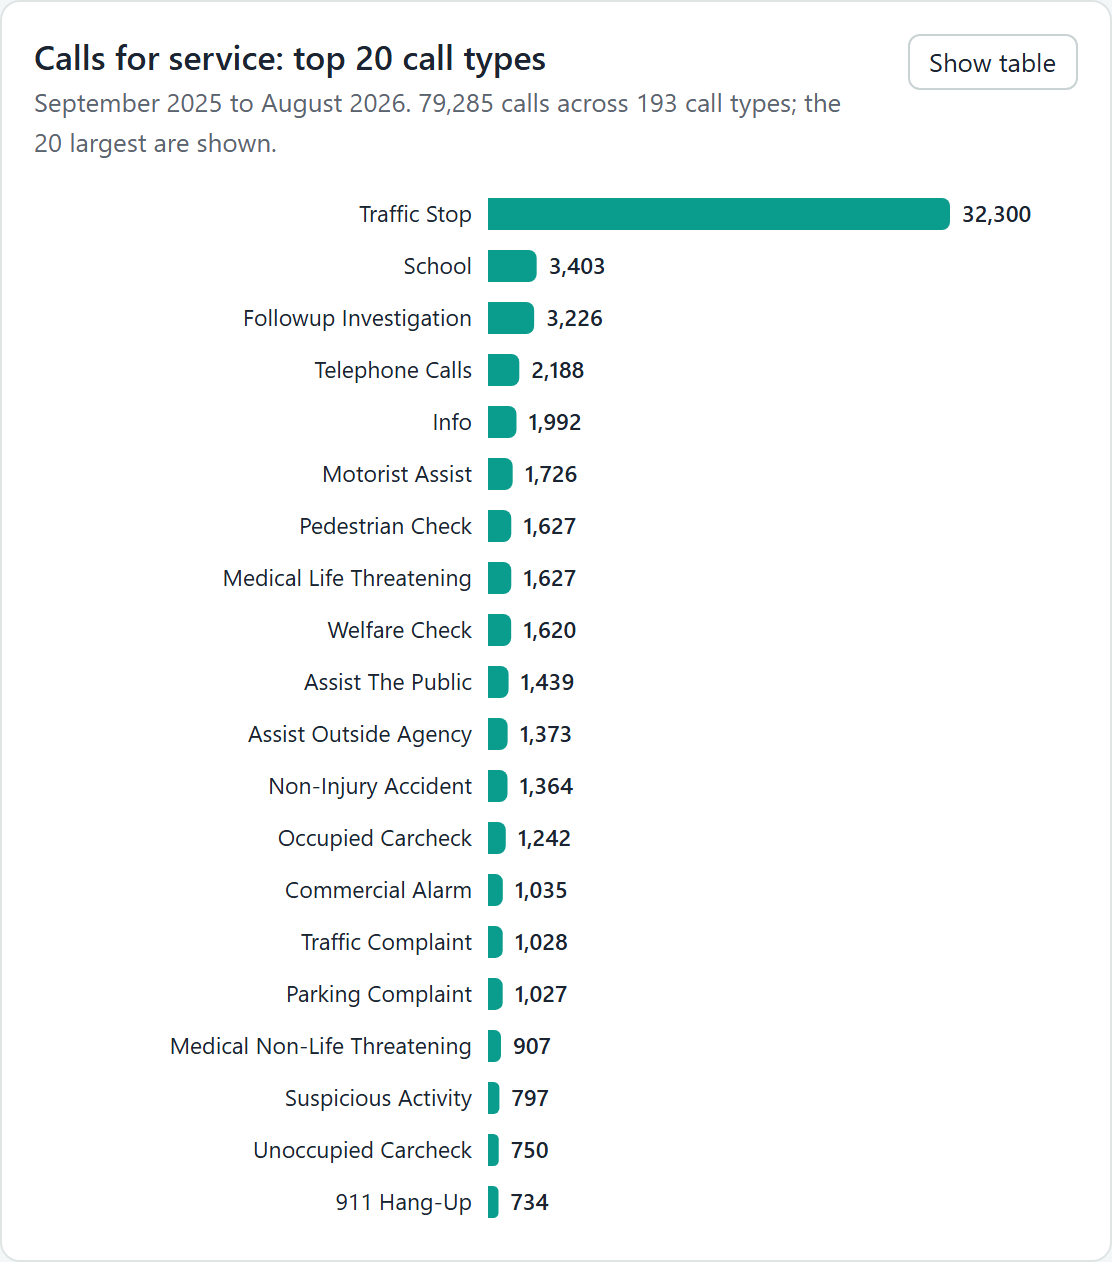
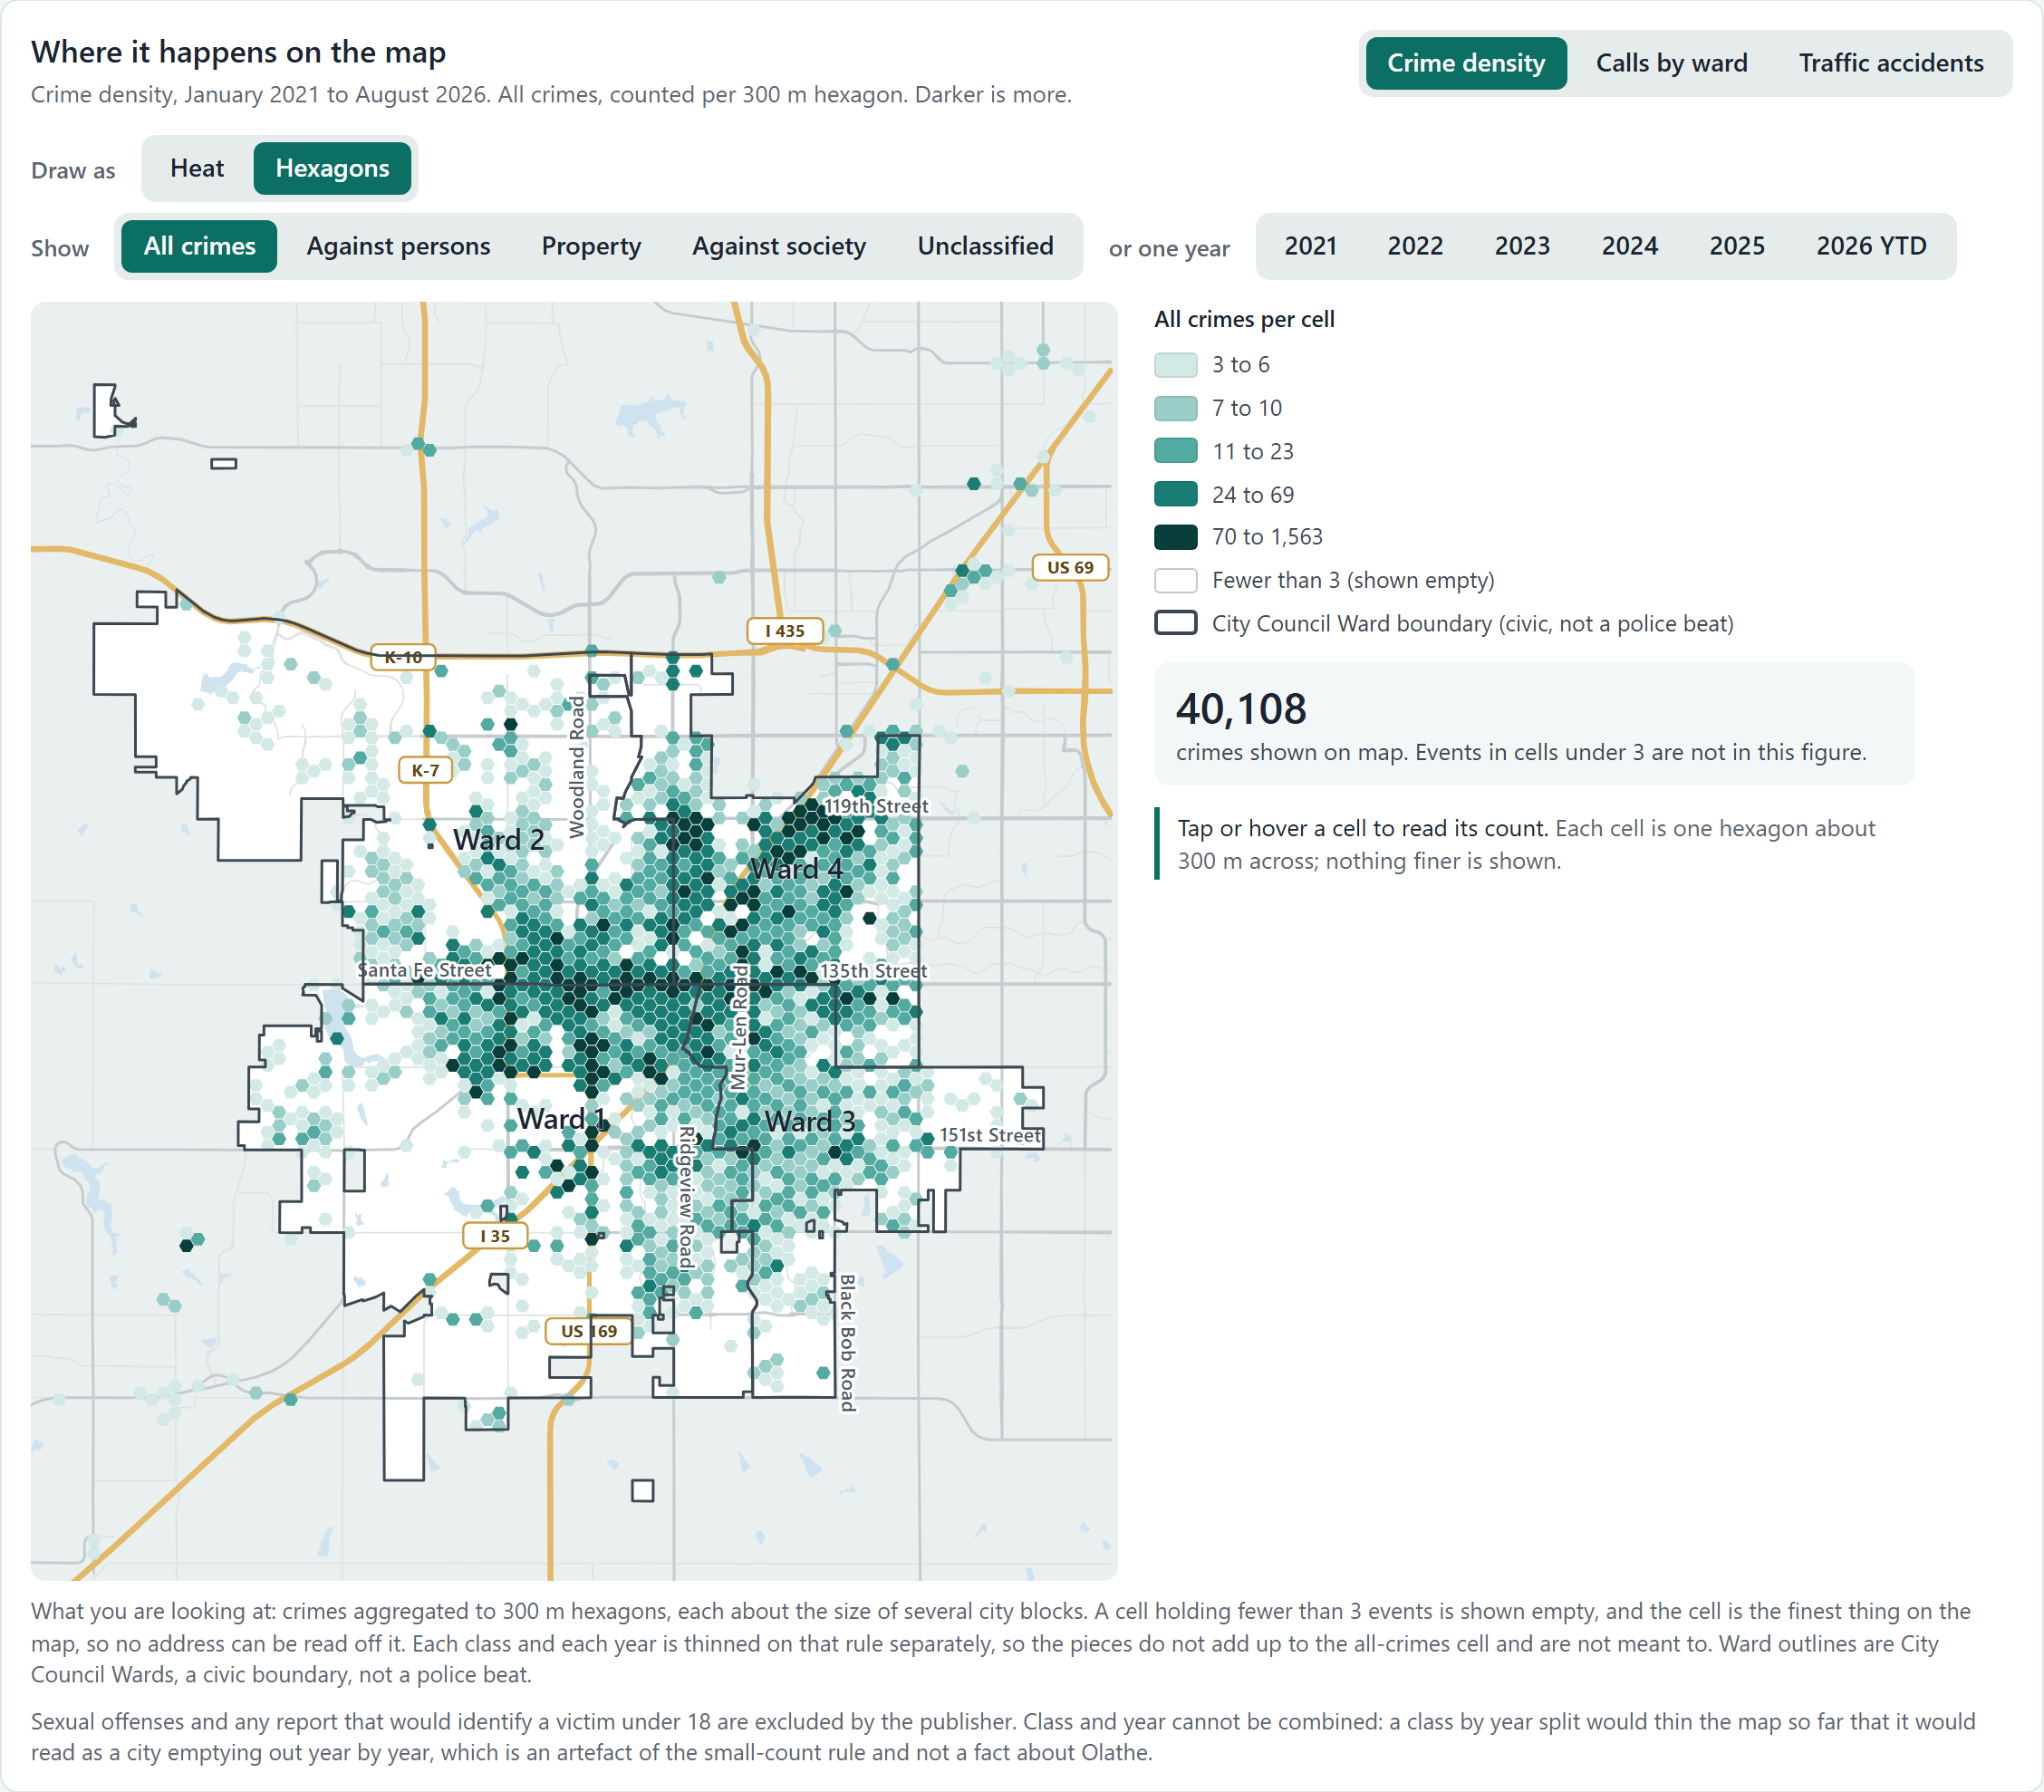
Data: Olathe Police Department, published on the City of Olathe Crime Map and Blotter (Johnson County AIMS), retrieved 2026-09-04. Streets: OpenStreetMap contributors, Open Database License. Counts only; no record level data and no personal field is used.
Four phases, about four to six weeks
The same four phases as every Blue Peak project (how we work). A first crime statistics dashboard takes about four to six weeks from the export landing to the handoff session.
Discovery, week 1
We read your export, list every field, and agree in writing what the first page has to answer. You get a written scope and a written quote before anything is signed. If your own analyst could build it in an afternoon, we say so.
Solution design, weeks 1 to 2
The data model and the measures get defined once: what counts as a crime, how NIBRS classes roll up, how a date range behaves, what "prior year" means in February. Definitions live in the model, not on each page, which is why the numbers stop disagreeing.
Implementation, weeks 2 to 5
Pages built against your real data and reviewed with you as they go, not presented for the first time at the end. One review round is in the price; more are fine and are scoped as they come.
Optimization and handoff, weeks 5 to 6
Published in your tenant, access set, documentation written, a working session with whoever will maintain it. Thirty days of tuning after the first release. Then the .pbix file is yours. If you never call us again, everything keeps running.
How the work is priced
A quote, from a written scope.The smallest build is one Power BI page from one export, published in your tenant, documented, with a handoff session and thirty days of tuning. Tell us what your department needs and we reply with a written quote.
The monthly board PDF and the analyst workbench are quoted from the same written scope, so you see what each part covers before you decide.
No annual licence from us, no hosting fee, no seat count. If your agency already has Power BI through Microsoft 365, there is usually nothing further to buy. Each phase is its own purchase and its own invoice, Net 30, on acceptance.
Public dashboards and report PDFs also fall under the federal web accessibility rule: April 26, 2027 for governments of 50,000 or more, April 26, 2028 for smaller ones. We also offer a pre-deadline accessibility check as a separate piece of work. We check your public dashboards and statistics PDFs, fix what the tools allow, and document what still falls short. Power BI can't fully meet WCAG 2.1 AA, so we don't promise conformance; we tell you where you stand.
Questions analysts ask
What data do you need?
The export your RMS or CAD already produces: a CSV, a scheduled extract, or a reporting view your vendor provides. On a first project we do not ask for direct access to the records system. The build works from the CSV or Excel file your RMS or CAD already exports and the NIBRS offense code on each record, and it does not connect to the records system itself. The workbook your analyst already maintains is often the fastest source of counting rules, because they live nowhere else.
Do you work with NIBRS?
Yes. The crime statistics page groups on the NIBRS offense code your records carry, and a reconciliation page can show where your local count and your state NIBRS submission differ and why. We will not claim familiarity with a records system we have not worked in; we read your export, ask about every ambiguous field, and write down what each one means.
Is this a Power BI dashboard or a website?
Your deliverable is Power BI, in your own Microsoft tenant. The demo on this page is a web page because a demo should work without a login. The same charts are built with Power BI's own visuals on your project.
Where does our data go?
Nowhere outside your environment. Reports are built and published in your agency's Microsoft tenant. Nothing is copied to a Blue Peak server and nothing goes to an outside service for processing. Where data can be aggregated or stripped of identifiers before we see it, that is the version we would rather have.
What about CJIS?
You pick one of two ways of working. Either your IT issues a guest account inside your own tenant, subject to whatever agreement, training and screening your CJIS terminal agency coordinator requires, or we work entirely from exports you choose and control. If policy rules out an outside account, exports are enough.
Who sees what?
Row level security in one model: command staff see everything, a supervisor sees their squad, an aggregated public view carries no case detail. The rules are documented so your IT staff can audit them.
Who owns the work?
You do. The .pbix file, the data model, the measures and the documentation are handed over at the end of the project with no licence back to us. Your analyst can change anything without calling us.
Can a department that has never done this buy it?
Yes. Each phase is a separate written scope, acceptance and invoice. If your purchasing office needs a quote with a statement of work attached or a sole source justification, say so and it is yours. Blue Peak is a SAM.gov active small business, UEI PRPBEM9HEND3, CAGE 15CS5.
Our department's Power BI report is slow. Can you fix it without seeing our data?
Yes. Send the report as a template, which holds no records, plus its Performance Analyzer timings. We return it tuned within five business days with a before-and-after timing sheet, and you run it against your own data.
Who does the work?
Blue Peak's senior team, and the consultant who scopes your dashboard is the one who builds it. Our lead consultant brings twelve years in production analytics, most of it in Power BI, SQL Server and the Microsoft stack, including reporting on a $30M multi-jurisdictional federal initiative and an analytics product line used by more than 100 people at a national telecom. That record was earned before Blue Peak, so we describe it as our people's experience rather than the firm's past performance, on purpose.
Send us the report you hate producing
Name the recurring report that costs you the most time: the monthly crime statistics packet, the quarterly NIBRS reconciliation, the beat question that returns every schedule change. One line is enough, plus a rough figure for how long it takes today.
You get an honest read back within one business day: what it would take, roughly what it would cost, and whether it is worth doing at all.